The emissions we do not see
Most of us know that a car exhaust emits carbon dioxide. But what about the steak on our plate, the electricity charging a phone, the shirt we are wearing, the sofa in the living room, or a two-hour flight? None arrives with a visible cloud of emissions attached to it. Yet each has a carbon history.
That history is often hidden in another place or another time: at a power station, on a farm, in a mine, at a factory, aboard a cargo ship, or in the materials used to make a product. A personal carbon footprint is therefore not one activity. It is the combined result of everyday life moving through larger systems of energy, agriculture, manufacturing and transport.
CO₂ means carbon dioxide. CO₂e, or carbon dioxide equivalent, is a wider measure that also expresses the warming effect of other greenhouse gases, including methane and nitrous oxide, in a common unit.
A familiar journey by car
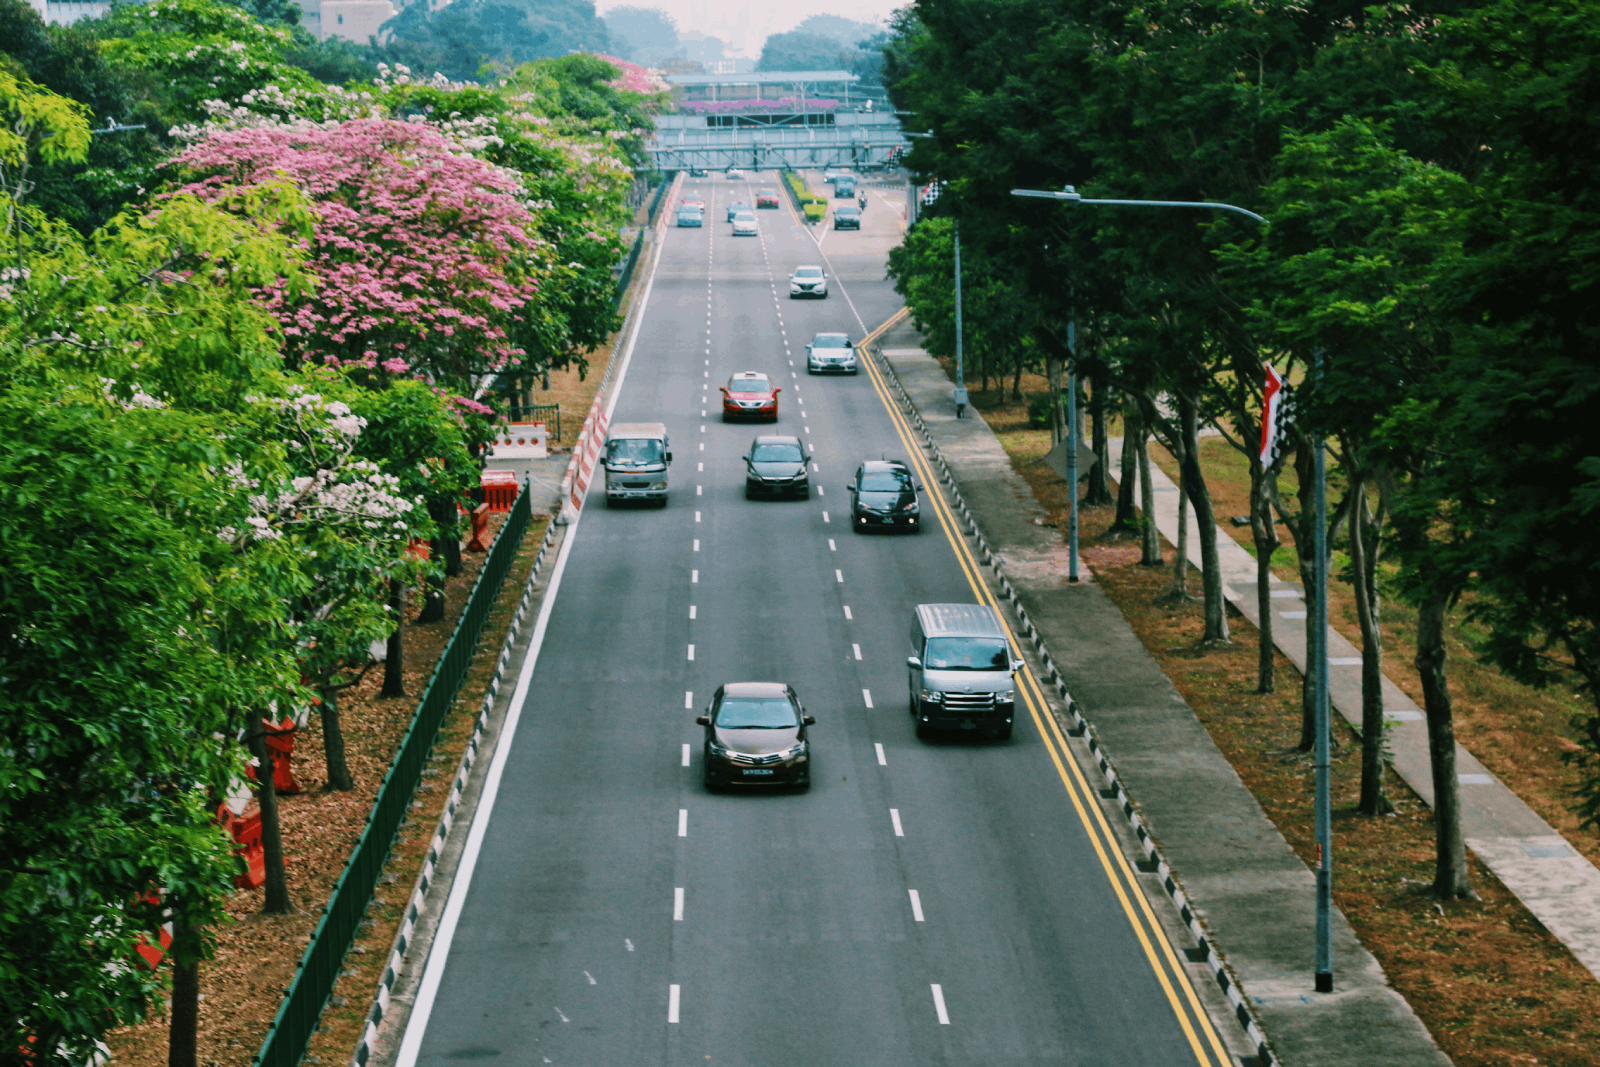
A car journey is one of the few everyday activities where emissions feel tangible. For a representative average petrol car, travelling 100 kilometres is associated with roughly 16 kg CO₂e. In this simplified example, the vehicle’s manufacturing and road infrastructure are not included; a full lifecycle assessment would include both.
What changes most immediately is not the road or the engine, but the number of people sharing the trip. The car travels almost the same journey whether one person is inside or three.
| People in the car | Approximate emissions per person for 100 km |
|---|---|
| 1 person | About 16 kg CO₂e |
| 2 people | About 8 kg CO₂e |
| 3 people | About 5–6 kg CO₂e |
These are representative figures based on the UK Government greenhouse gas reporting conversion factors. Exact results depend on vehicle size, fuel, engine efficiency, driving conditions and occupancy. The useful insight is simple: sharing a journey changes the emissions attributable to each traveller.
Why flying is harder to estimate
Flight time alone does not tell the whole story. Take-off, climb, cruise and descent use fuel differently, while aircraft type, passenger occupancy, cargo and the actual route all matter. The ICAO Carbon Emissions Calculator uses route-specific aircraft data, fuel consumption, passenger load factors and cabin configuration rather than a single universal number.
As illustrative economy-class examples, a return journey of roughly 1,000 km may be associated with about 100–130 kg of direct CO₂ per passenger. A return journey of roughly 2,400 km may be around 200–250 kg CO₂ per passenger. These are not universal values, but useful scale markers for routes that might be scheduled around one and two hours each way, respectively.
These figures describe direct CO₂ from aircraft fuel combustion. Aviation also has non-CO₂ climate effects at altitude. Those effects matter, but methods for estimating them differ, so it is more accurate not to apply one fixed multiplier casually. ICAO explains its approach in its calculator methodology.
The carbon footprint on the plate
Breakfast can look ordinary: coffee, milk, eggs, toast, perhaps fruit. Yet food is one of the clearest examples of why emissions cannot be understood only by looking at transport. What we eat often matters more than how far it travelled.
The global averages below draw primarily on Poore and Nemecek’s 2018 research, published in Science and presented by Our World in Data. The underlying study covered about 38,700 commercially viable farms in 119 countries and 40 food products. Its lifecycle estimates include major parts of the supply chain: land-use change, farm emissions, animal methane, feed, fertilizer, processing, transport, packaging and retail.
| Food | Approximate global mean lifecycle emissions |
|---|---|
| Beef from beef herds | ~60 kg CO₂e per kg |
| Lamb and mutton | ~24 kg CO₂e per kg |
| Cheese | ~21 kg CO₂e per kg |
| Dark chocolate | ~19 kg CO₂e per kg |
| Coffee | ~17 kg CO₂e per kg |
| Farmed shrimp | ~12 kg CO₂e per kg |
| Pork | ~7 kg CO₂e per kg |
| Poultry | ~6 kg CO₂e per kg |
| Farmed fish | ~5 kg CO₂e per kg |
| Eggs | ~4.5 kg CO₂e per kg |
| Rice | ~4 kg CO₂e per kg |
| Milk | ~3 kg CO₂e per kg or litre |
| Tofu | ~3 kg CO₂e per kg |
| Tomatoes | ~1.4 kg CO₂e per kg |
| Wheat and rye | ~1.4 kg CO₂e per kg |
| Peas | ~0.9 kg CO₂e per kg |
| Bananas | ~0.7 kg CO₂e per kg |
| Apples | ~0.4 kg CO₂e per kg |
| Root vegetables | ~0.4 kg CO₂e per kg |
They are global averages, not labels for every farm or every meal. Actual values can vary substantially between production systems and places. Still, the broad pattern helps explain why the invisible parts of food production—especially land use, livestock methane and farm inputs—can be so consequential.
Why “processed” is not one category
Processing can add energy use, ingredients, refrigeration and packaging, but it does not create one universal carbon value called “processed food.” The underlying ingredients still matter greatly. A lifecycle assessment of cooked ham reported about 13.4 kg CO₂e per kg, while noting earlier French estimates of about 7.7–8.6 kg CO₂e per kg. That range, documented in a 2021 lifecycle study of ham processes, is a reminder that product and production details matter.
A processed vegetable product can look very different. One lifecycle study found about 0.72 kg CO₂e per kg for fresh-cut vegetables and 0.86 kg CO₂e per kg for pre-cooked vegetables. Processing is part of the story, not the whole story.
The electricity behind the socket
Plugging in a laptop or phone produces no visible exhaust. But the footprint of that electricity can differ enormously according to how it was generated. A useful comparison looks at lifecycle emissions, not only what leaves a smokestack. That means considering construction, materials, fuel extraction where relevant, operation, maintenance and eventual decommissioning.
| Electricity source | Lifecycle range | Approximate emissions per 1 MWh |
|---|---|---|
| Coal | 751–1,095 g CO₂e/kWh | ~750–1,100 kg CO₂e |
| Natural gas combined cycle | 403–513 g CO₂e/kWh | ~400–510 kg CO₂e |
| Nuclear | 5–7 g CO₂e/kWh | ~5–7 kg CO₂e |
| Onshore wind | 8–16 g CO₂e/kWh | ~8–16 kg CO₂e |
| Offshore wind | 12–23 g CO₂e/kWh | ~12–23 kg CO₂e |
| Solar PV | 8–83 g CO₂e/kWh | ~8–83 kg CO₂e |
| Hydropower | 6–147 g CO₂e/kWh | ~6–147 kg CO₂e |
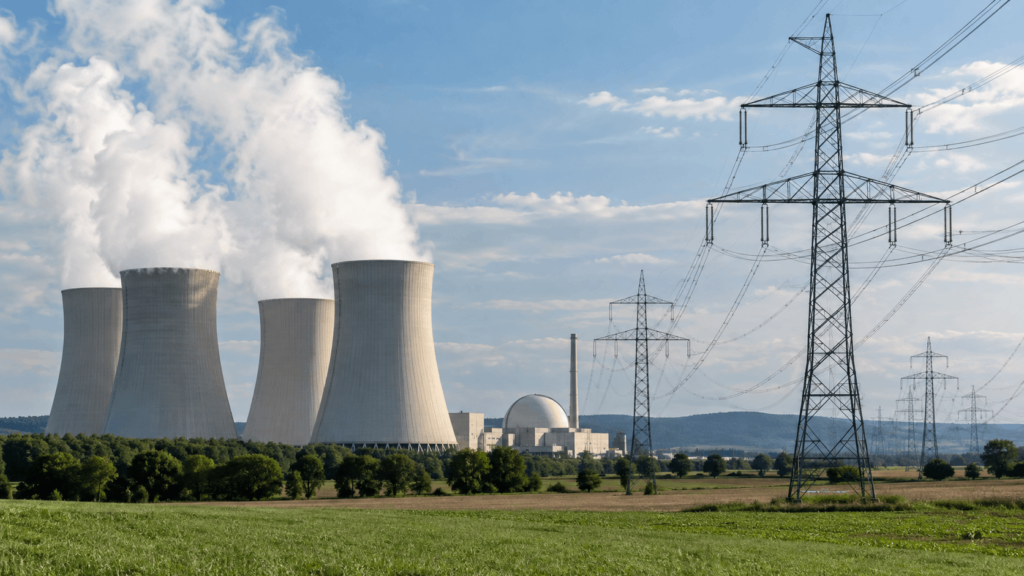
These representative lifecycle ranges come from the UNECE Life Cycle Assessment of Electricity Generation Options. Technologies without combustion during operation are not literally zero-carbon: steel, concrete, silicon, copper, mining, construction and decommissioning all have emissions. Yet lifecycle studies show that their overall emissions can remain dramatically lower than fossil-fuel generation.
The grid has a footprint too
Generation is only part of the journey. Electricity reaches a wall socket through transmission lines, distribution networks, substations, transformers, cables, steel towers, copper, aluminium, concrete, maintenance and replacement infrastructure. Grid lifecycle footprints vary strongly between countries and system designs, so there is no responsible single number to add to every source of electricity.
Grid losses also mean that slightly more electricity must be generated than ultimately reaches a home or business. A kilowatt-hour at the socket has a physical system behind it, even when that system is out of sight.
The life before a garment
A cotton T-shirt or pair of jeans can seem like a simple object. Before it is worn, however, cotton or synthetic fibres must be produced, spun, woven, dyed, sewn, packaged and transported. There is no responsible universal carbon value for “one shirt”: material, weight, factory energy, dyeing, production location and product lifetime all change the result.
At a broader level, the European Environment Agency estimates that the supply chain associated with textile consumption by EU households produced roughly 355 kg CO₂e per person in 2022. This is embodied emissions: much of the climate impact was created before a garment reached a wardrobe.
What a sofa carries
Furniture becomes almost invisible once it settles into a home. A sofa or dining table looks passive, but much of its footprint was created before delivery: wood harvesting, metal production, foam, textiles, adhesives, manufacturing, packaging, transport and end-of-life treatment.
Furniture varies too much for one universal figure. As one product example—not an industry average—a published Environmental Product Declaration for a particular three-seat sofa reported a lifecycle footprint of approximately 218 kg CO₂e. The point is not that every sofa has that footprint, but that familiar household objects can carry substantial embodied emissions. Lifecycle research comparing furniture products reaches the same broader conclusion: materials, design, manufacturing and use assumptions all matter.
The things we buy
Detergent, cosmetics, smartphones, computers, televisions, mattresses, kitchen appliances, toys and packaging all have their own histories. Much of a personal footprint occurs somewhere we never see: a mine, farm, factory, power station, warehouse, cargo ship or recycling facility.
The lifecycle is easy to describe even when it is difficult to measure precisely: raw materials, manufacturing, packaging, transport, use and end of life. Some products use most of their energy while operating; for others, the largest share may be embedded in materials and manufacturing. Where comparable lifecycle figures are unavailable, it is better to acknowledge that uncertainty than to invent a neat number.
Making the invisible visible
Our carbon footprint is not one cloud following us around. It is distributed across thousands of places, machines and processes. Some emissions come directly from things we can see—a car exhaust or an aircraft engine. Others happened months earlier, thousands of kilometres away, while making something we use every day.
Understanding that difference does not mean every decision has to become a climate calculation. It simply gives us a clearer picture of what our choices physically require. And once an invisible impact becomes visible, it becomes easier to understand.
Sources and further reading
- UK Government: Greenhouse gas reporting conversion factors 2026
- International Civil Aviation Organization: ICAO Carbon Emissions Calculator and its methodology
- Poore, J. & Nemecek, T. (2018), Reducing food’s environmental impacts through producers and consumers, Science
- Our World in Data: Environmental impacts of food
- Comparing Innovative Versus Conventional Ham Processes via Environmental Life Cycle Assessment, Applied Sciences, 2021
- UNECE: Life Cycle Assessment of Electricity Generation Options
- European Environment Agency: Greenhouse gas emissions from EU textiles consumption