The Keeling Curve · A short read, a longer view
Unlock your phone. Make coffee. Take a breath. That last part feels just like it did a lifetime ago. The air has changed.
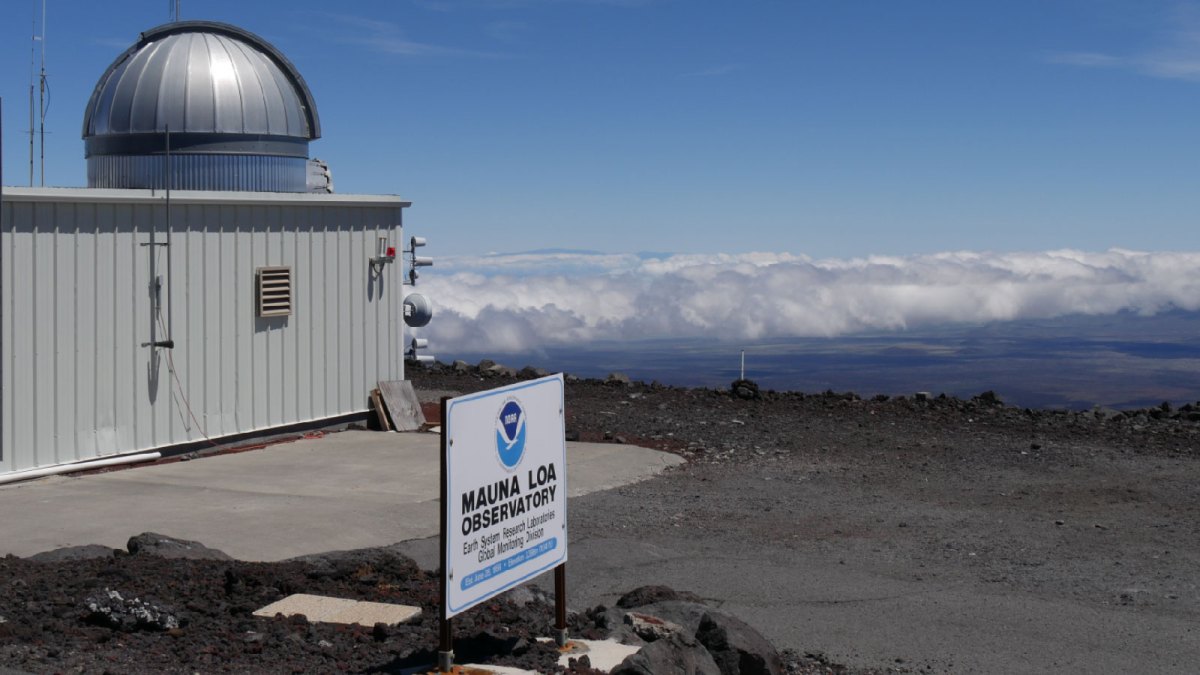
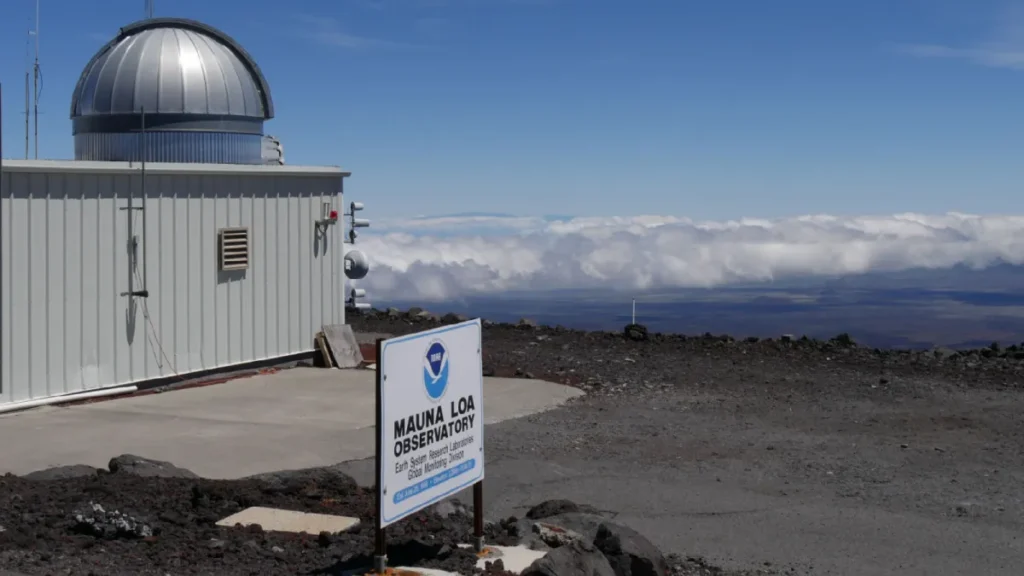
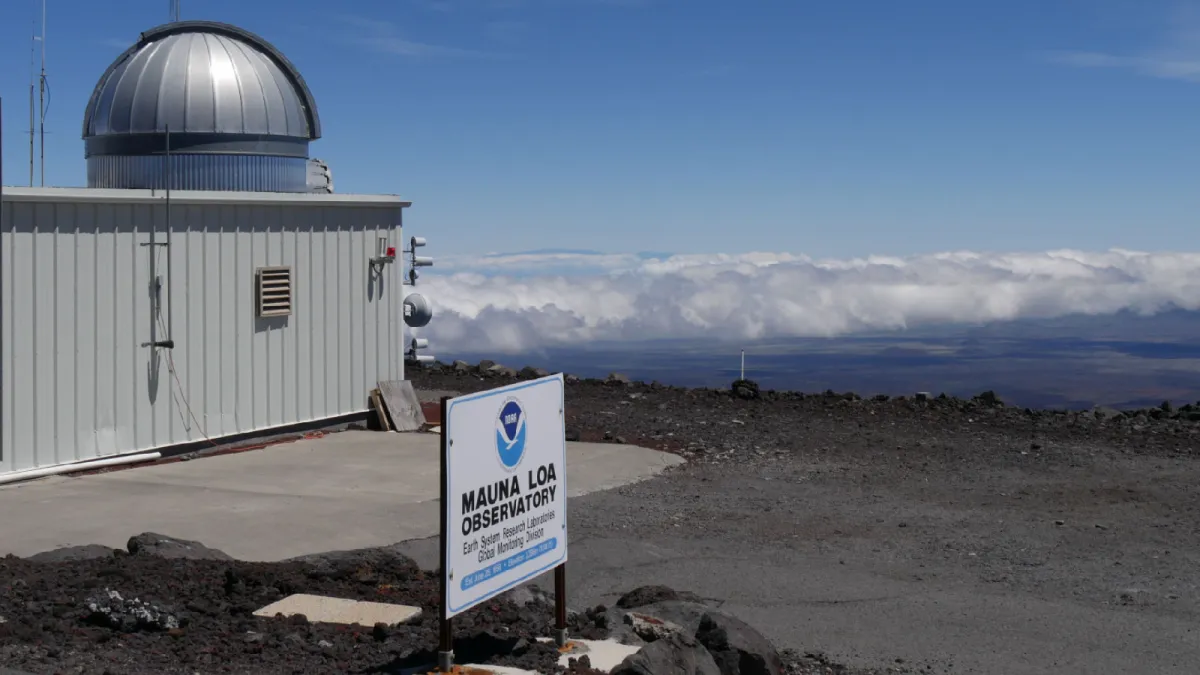
When Charles David Keeling began measuring CO₂ at Mauna Loa in 1958, the air contained about 315 parts per million. The annual average in 2025 was 427.35 — roughly 427 CO₂ molecules in every million molecules of dry air. Scripps · NOAA
The Keeling Curve tracks that rise. Watch one lifetime unfold. Then pull back a thousand years. Then eight hundred thousand.
A familiar breath. An unfamiliar story.New to the Keeling Curve? If this changed how you see the air, share the chart on your own website.
Why the teeth?
Earth’s two halves have opposite seasons. But they do not cancel each other out: most land lies north of the equator, and northern vegetation dominates the seasonal rhythm. During northern summer, growing plants draw CO₂ out of the air. In autumn and winter, photosynthesis weakens while respiration and decay keep returning it. NOAA: the seasonal cycle
Opposite seasons. One atmosphere.
Watch four measured years of CO₂, with a schematic seasonal overlay.
Equal Earth preserves relative areas. Seasonal colours are schematic, not measured vegetation or carbon flux.
Northern summer draws CO₂ down; northern autumn and winter usually bring it back up as growth slows and respiration and decay continue.
NOAA GML / Scripps · monthly means, 2021–2024 · map: supplied Equal Earth SVG / Natural Earth
The seasonal dip does not undo the long climb, driven mainly by burning fossil fuels. Nature’s annual rhythm sits on a rising baseline. The history of the curve
A longer view changes the picture.
Ancient air trapped in Antarctic ice puts the displayed pre-industrial CO₂ range at roughly 170–300 ppm over about 800,000 years. The 2025 value stands above it. In that deep-time view, temperature means Antarctica; the modern comparison uses the global average. Ice-core data
Why care? CO₂ slows heat escaping to space. More of it strengthens warming, even as other influences make temperatures fluctuate. NASA
Between two cups of coffee, you won’t notice the change. Across one lifetime, it becomes an entire rising line.
What the charts show
One lifetime: NOAA’s combined monthly Mauna Loa series, March 1958–December 2025. Early values are from Scripps. These are processed monthly means, not individual readings; the source interpolates missing months. The volcanic interruption from December 2022 to early July 2023 uses Maunakea observations.
Temperature: annual Mauna Loa CO₂ and NASA GISTEMP v4 global land–ocean temperature, 1959–2025. Temperature is the anomaly relative to 1951–1980, not absolute temperature or a pre-industrial baseline. The 2025 anomaly is +1.19 °C on that basis. Mauna Loa is one CO₂ monitoring site, not a global CO₂ mean.
The last 1,000 years: the supplied 2 Degrees Institute / Climate Levels CSV, dated 18 September 2026, contains 6,494 values from 1010 to 15 September 2026. It combines an early ice-core-based history with much finer modern atmospheric data. We retain its values and dates; they do not all represent measurements of the same frequency or precision. The export does not supply per-row uncertainty or processing history. The c. 1760 guide marks the conventional start of Britain’s Industrial Revolution, not an instantaneous change in CO₂. Science Museum: industrial context · CO2.earth source page · Climate Levels / 2 Degrees Institute
800,000 years: CO₂ from Bereiter et al. (2015), stopping at 1850; Antarctic Dome C temperature from Jouzel et al. (2007), relative to the source’s mean of the last 1,000 years. Ages are years before 1950. The two records have different chronologies, sampling intervals and uncertainties. Vertical guides mark selected cold minima, rounded to the nearest thousand years, rather than formal global glacial boundaries. The 2025 Mauna Loa annual mean is a separate CO₂ point; its dashed connector is only a visual guide. We do not append modern global temperature to Antarctic paleotemperature.
The seasonal map: a conceptual colour layer on the supplied world SVG, synchronized with actual monthly CO₂ for 2021–2024. Yellow means summer and blue winter; intermediate colours show transitions. Seasons are opposite across the equator, but tropical and regional growing cycles differ. The Equal Earth projection preserves relative areas; colours are not measured temperature, vegetation cover or carbon flux. Northern CO₂ usually peaks around May and bottoms out around early autumn. NOAA: seasonal exchange
Animations reveal existing data. The moving cursor is visually interpolated between samples; numerical readouts use source values. Similar-looking curves alone do not establish causation or precise time lags. Orbital changes and climate–carbon feedbacks both matter in glacial cycles. NASA: the carbon cycle
Data retrieved 18 September 2026. The lifetime and temperature views end in the last complete year, 2025; the supplied millennium export extends into 2026. Scales stay fixed within each view. In the lifetime and 800,000-year animations, the number and its sample date update once per second for readability; pause or scrub for the source precision. The line continues moving between these readouts. Reduced-motion preferences show a static view with manual scrubbing.