Follow a car through production, years of driving and the decisions that shape its carbon history.
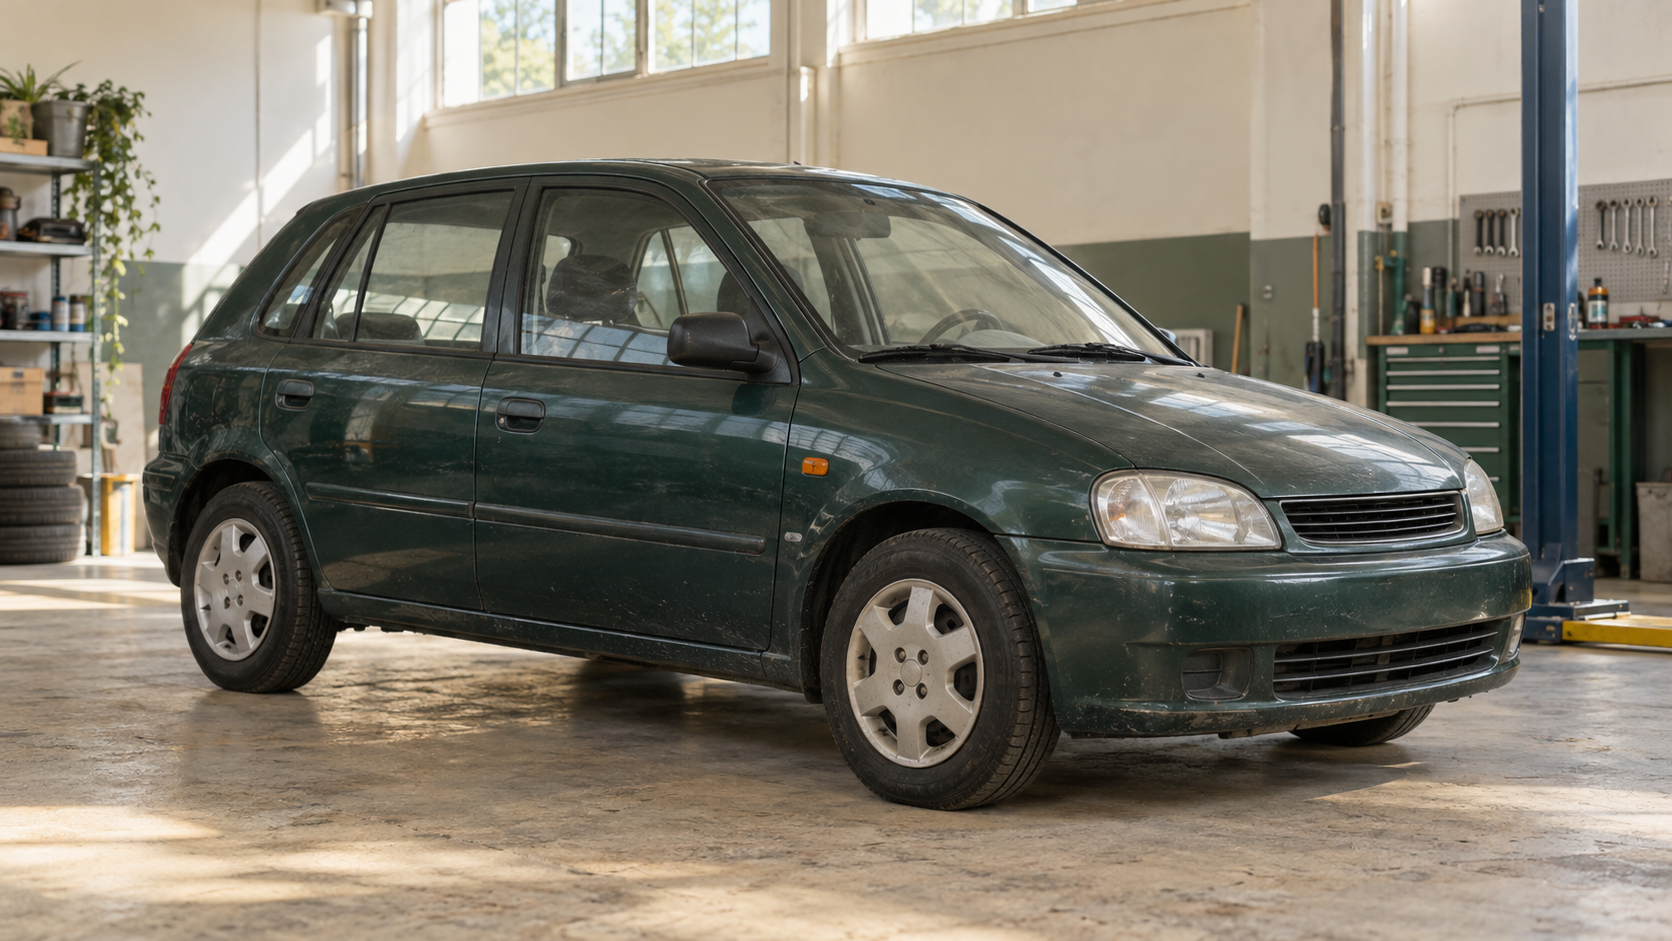
A car’s odometer keeps a record of journeys long after their details have faded. It also holds the raw material for a different kind of history: the CO₂ connected to making, fuelling and maintaining the vehicle.
Consider an illustrative petrol car with 220,000 km on the clock and an average consumption of 10.4 L/100 km. Its fuel use alone comes to 22,880 litres. At 2.34 kg CO₂ per litre of petrol, that is about 53.5 tonnes of CO₂ from combustion.
Fuel is only part of that history. The car already carried a production footprint before its first kilometre, and servicing adds further events over time.
So how much CO₂ has your car produced?
Open the calculator in a full page ↗
The tonnes behind the kilometres
The number may feel unexpectedly large because we usually encounter fuel in small purchases, not as a lifetime total.
For a combustion car, the central calculation is straightforward:
Distance × average fuel consumption ÷ 100 × CO₂ per litre.
In the example above, 220,000 × 10.4 ÷ 100 gives 22,880 litres. Multiplying by 2.34 kg CO₂ per litre gives roughly 53.5 tonnes.
How can the gas weigh so much? Burning fuel joins its carbon with oxygen from the air. The resulting CO₂ therefore weighs more than the fuel itself.
That is also why one generic “car emission” figure is a poor substitute for your own history. Distance and consumption matter.
If you have reliable long-run fuel records, use them. Otherwise, the catalogue value is a transparent starting point.
Time turns a rate into a history
At an unchanged fuel consumption, twice the distance means twice the fuel-combustion CO₂.
A conversion gives the history a change of direction. If a petrol car switched to LPG, its fuel use and emissions need to be calculated separately before and after the conversion.
For LPG, the calculator starts with 20% more litres than the petrol reading: 8.0 L/100 km petrol becomes 9.6 L/100 km LPG. It then applies the LPG factor for the relevant period.
A carbon history begins before the first kilometre
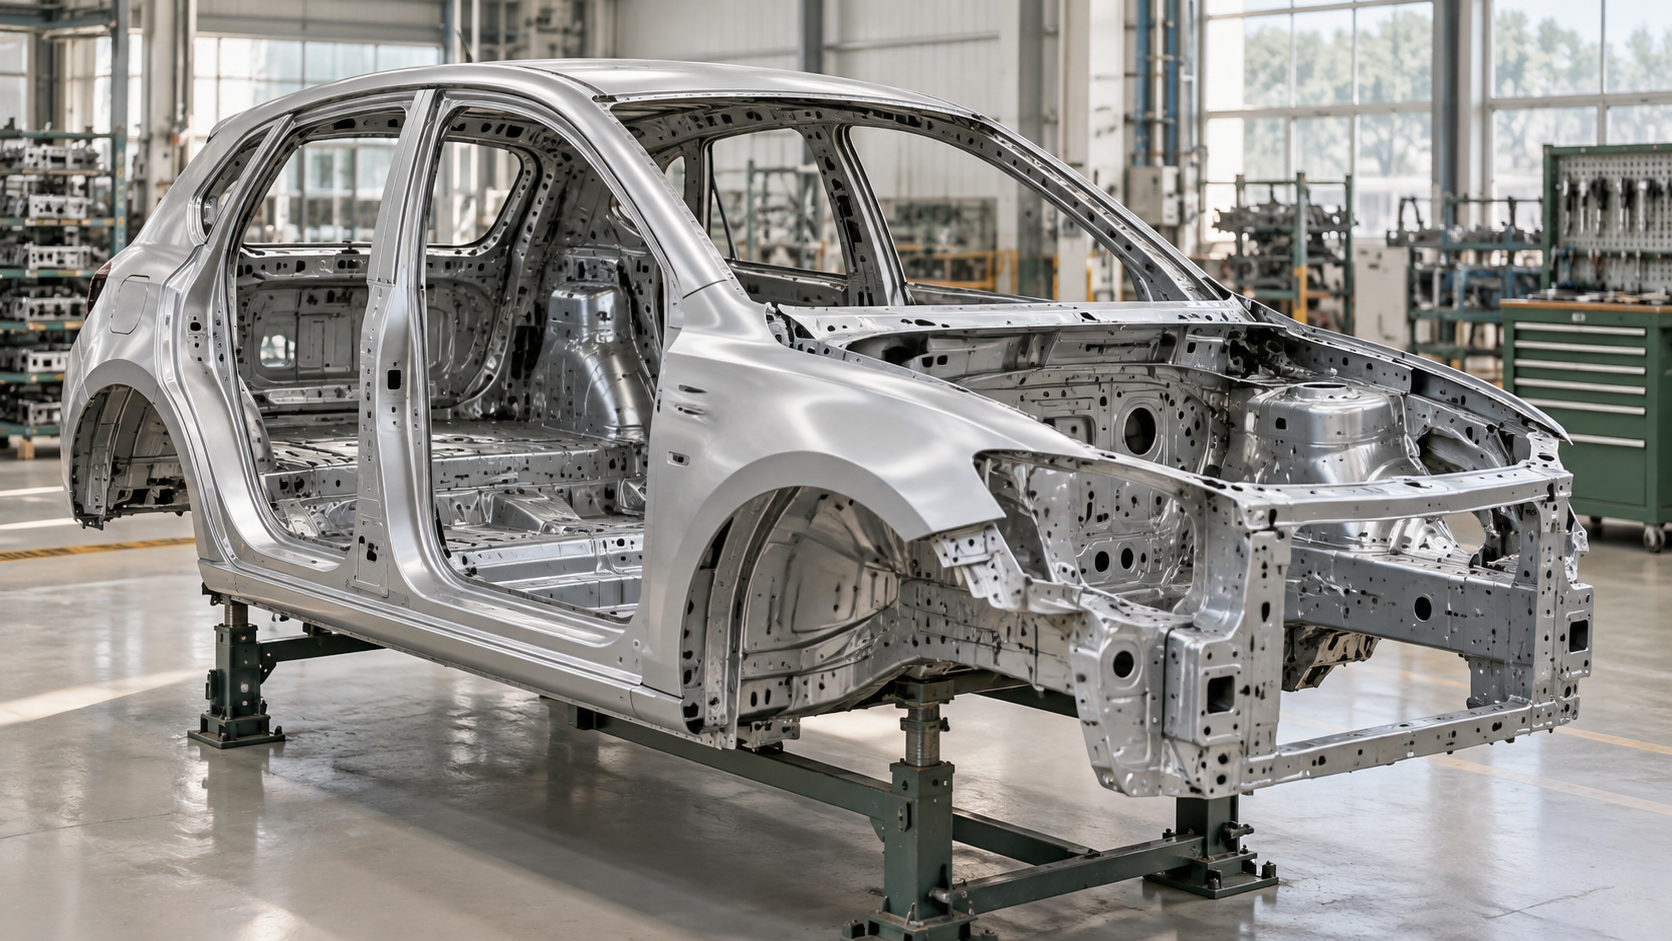
At zero kilometres, no driving fuel has been counted. Yet the car has already been made.
Materials had to be produced and formed, components manufactured, and the vehicle assembled and transported.
The difficulty is attaching an honest number to those earlier stages. Weight, material mix, manufacturing energy and supply chains all vary.
The production estimate uses vehicle mass where available, historical material and energy profiles, and a transparent physical-CO₂ inventory.
The physical-CO₂ inventory draws on historical European material and energy profiles. It is not a claim about a particular factory or supply chain.
One production event, several owners
The calculator provides two views. Vehicle history counts production once, at the beginning. Ownership history allocates a share of production to the years you owned the car.
ATLAS uses a chosen ten-year allocation: 25.6%, 19.3%, 14.6%, 11.1%, 8.5%, 6.5%, 4.9%, 3.7%, 2.8% and 2.1%.
If you bought a 1994 car in 2018, no production share falls within your ownership period. The vehicle still has a production footprint; it simply sits before your years of ownership.
Your mileage is also separate from its odometer. Buying at 100,000 km and driving 20,000 km means your ownership history covers those 20,000 km, not the earlier 100,000 km.
Why the average changes as you drive
For an illustrative production footprint of six tonnes of CO₂, the production average is 60 g/km at 100,000 km, 30 g/km at 200,000 km and 15 g/km at 400,000 km.
The million-kilometre explorer counts full production once and adds driving and service events as distance grows. It is a way to see how a fixed beginning is spread across a longer history.
Servicing leaves steps in the history
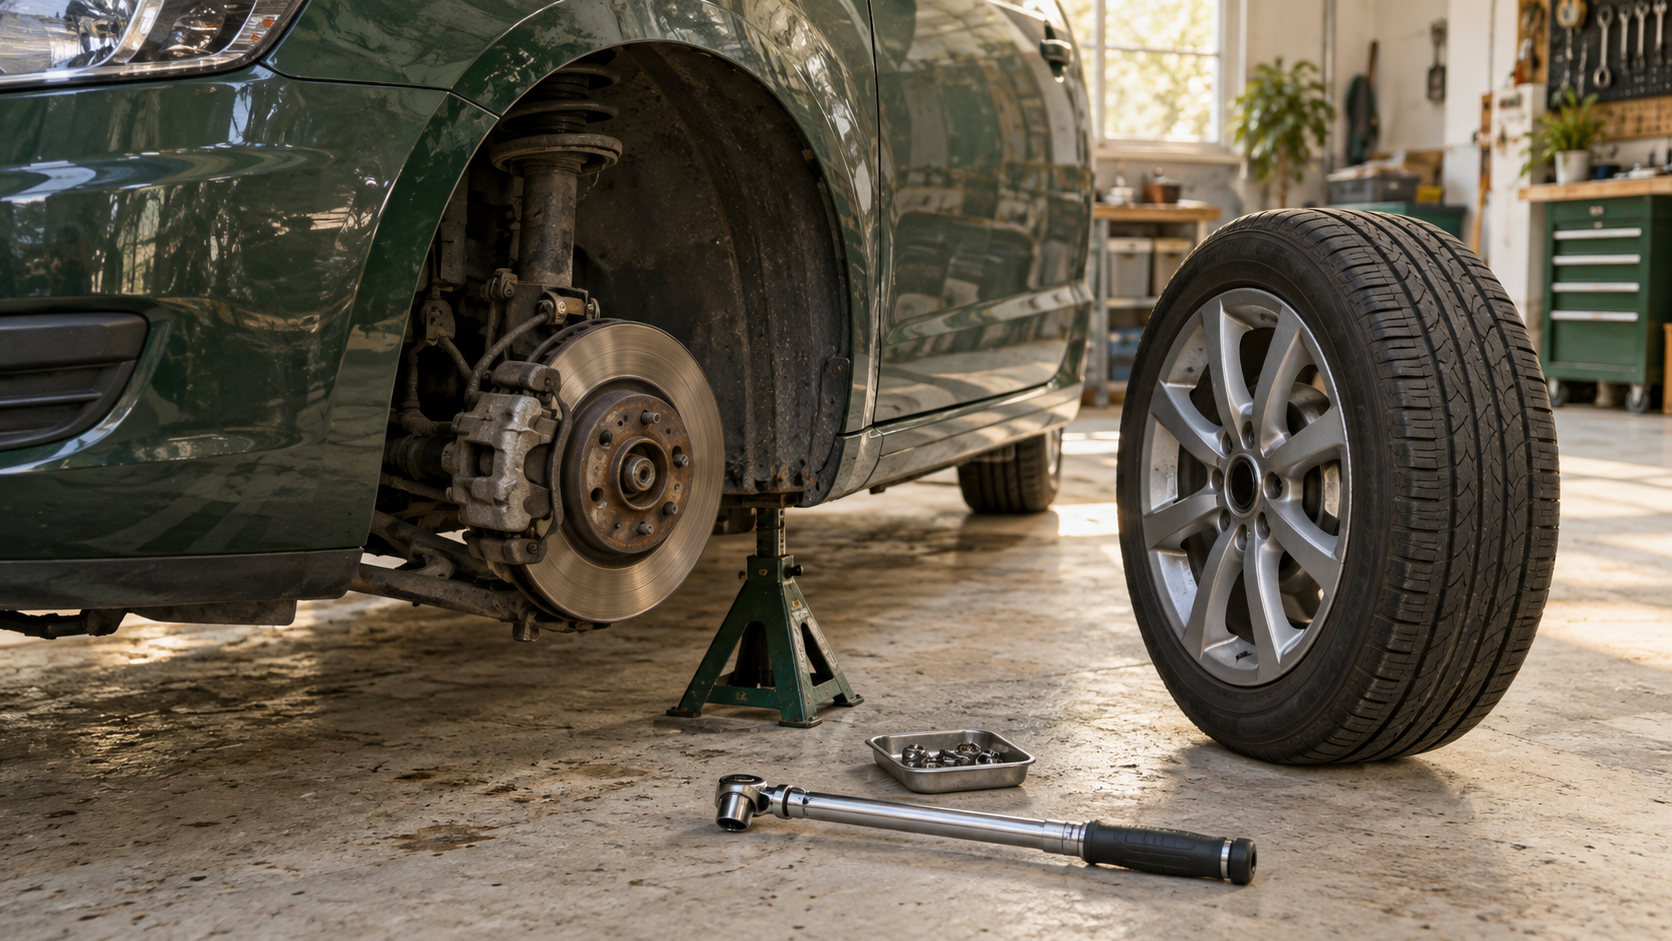
The annual bars show individual replacement events. Tyres, oil, brake parts, shocks, batteries and other components appear when their assumed service interval is reached.
These are generic schedules and assumed part quantities, not a reconstruction of a particular vehicle’s workshop record.
The events make timing visible, but extra detail does not guarantee extra accuracy. The calculator keeps the assumptions visible so you can judge their relevance.
Different fuels change the route to CO₂
Petrol, diesel, hybrid and electric cars all connect distance with energy, but the route differs. The calculator keeps those routes separate rather than forcing them into one generic number.